Last week I asked ‘Have we reached the tipping point?‘ in terms of the economy. Now it seems other observers are asking the same question – and coming to conclusions much like my own.
First, James Gruber bids us ‘Welcome To Phase Three Of The Global Financial Crisis‘. He points out that the emerging market crisis I mentioned last week “show … that the system based on easy money created by [central] bankers remains deeply flawed and these flaws have been exposed by moves to tighten liquidity in the U.S. and China. The system broke down in 2008, and again in Europe in 2011 and now in EM in 2013-2014”. He goes on to predict:
There are three possible endgames to the current situation:
- There’s a global deflationary shock where all asset prices fall and fall hard. A la 2008. In this instance, central banks would go in all guns blazing with more money printing on an even grander scale. This would risk inflation if not hyperinflation as faith in currencies is diminished, if not lost.
- You have a gradual global recovery and inflation stays tame enough for a smooth exit from current policies.
- There’s a recovery but central banks are slow to raise rates and inflation gallops, which forces tightening and a subsequent economic slowdown.
My bet remains on the first scenario given intensifying deflationary forces from a China economic slowdown and Japan currency debasement (which aids exporters in being more price competitive).
There’s more at the link. Worthwhile reading.
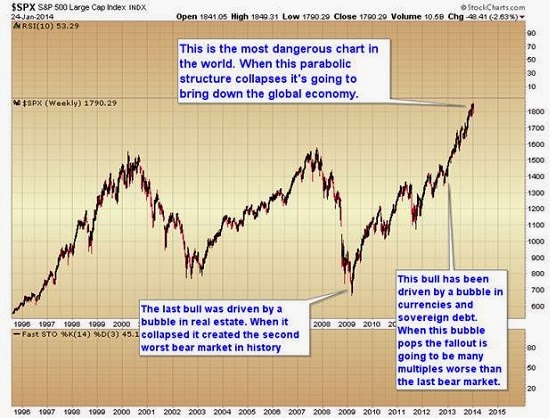
Second, the Kitco Commentary calls this graphic ‘The Most Dangerous Chart In The World‘.
Last month I warned about the bubble in the stock market, and what was going to happen when it popped. Make no mistake the chart of the S&P is the most dangerous chart in the world. When this parabolic structure collapses, it is going to bring down the global economy.
Here’s what we need to watch next week. If the Fed can turn this market around and prevent the S&P from breaking through this intermediate trend line over the next two weeks, then this will turn into just a normal daily cycle correction and will be followed by a fifth daily cycle that should include the melt up phase of this bull market.
If on the other hand the selling pressure overwhelms the plunge protection team’s efforts to hold it back and breaks through that intermediate trend line early in the week then we are witnessing the collapse of the parabolic structure and I wouldn’t expect it to stop until we reach the 2000 and 2007 previous bull market high support zone.
. . .
You don’t need wage growth to have inflation. You just need a central bank to destroy your currency. The Fed has already destroyed our currency. At the moment the inflation is being stored in the stock market, bond market, and echo bubble in the real estate market.
Again, more at the link, along with many more charts to explain the author’s points.
If you were wanting a sign of the economic times . . . I think you’ve got rather more than one right now. Take heed, and prepare yourselves accordingly.
Peter

That last bubble is only a bubble if we consider the US$ to be static. If we plotted stock prices against commodity prices the line would essentially be bobbing just above and below "no change" for all of the period since the housing crash.